EV Fleet Depot Charging: A Complete Design & Management Guide for CPOs [2026]
A logistics company in Phoenix added 40 electric delivery vans to their fleet in 2023. By month three, they had a crisis. Drivers were returning to the depot at 4 PM, eleven vans needed simultaneous charging for a 7 AM departure, and the facility’s electrical panel could support seven. Their utility bill spiked $18,000 in a single month from unmanaged demand charges triggered by uncoordinated plug-ins. Nobody had planned the charging infrastructure before the vehicles arrived.
That scenario is now repeating across American commercial fleets wherever EV adoption outpaces infrastructure planning. Fleet depot charging is the fastest-growing segment of CPO operations in 2026 — and also the most technically demanding. It is nothing like public charging. The economics are different, the engineering is different, and the operational priorities are completely different. Getting it right from the start is the difference between a fleet that electrifies smoothly and one that spends the next two years retrofitting mistakes.
Most fleet depot charging projects fail because of poor power planning—not because of the chargers themselves. Demand charges, electrical capacity and charging schedules determine whether a fleet saves money or faces rising operating costs. This guide explains how to design an EV fleet depot charging system that scales efficiently.
TL;DR: Fleet depot charging is economics first. The primary cost variable is not hardware — it is demand charges from unmanaged simultaneous plug-ins. Smart charging management consistently delivers 35–55% reductions in electricity costs. Most last-mile delivery depots are best served by Level 2 AC as the primary charger, with DC fast charging added selectively for time-critical scenarios. Engage your utility 12–18 months before your first vehicle arrives. Plan for five-year fleet scale, not Phase 1 headcount.
Table of Contents
What Is Fleet Depot Charging and Why Is It Different?
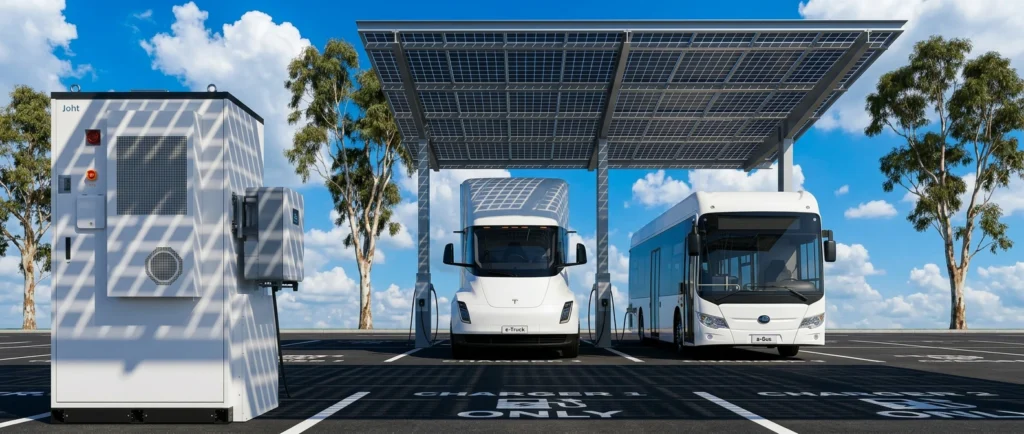
Fleet depot charging describes a model where an electric vehicle fleet charges at a central location — a warehouse, delivery hub, fleet yard, or bus garage — during scheduled off-duty windows. The vehicles are not serving the general public. The chargers are not priced per kilowatt-hour at a touchscreen. The entire system is optimized for one outcome: every vehicle in the fleet is ready to depart on time, every day, at the lowest possible energy cost.
Defining the Fleet Depot Charging Model
In the public charging world, the primary KPI is charger utilization — how many sessions per day, how much revenue per port. In fleet depot charging, utilization is almost irrelevant. The primary KPI is vehicle readiness rate: the percentage of vehicles that reach their minimum required state of charge before the morning dispatch window. A depot with 95% charger utilization but 8% of vehicles not ready at 6 AM has failed. A depot with 40% charger utilization where every vehicle leaves on time has succeeded.
This shift in success metric changes everything downstream: charger selection, power management strategy, software requirements, and how the CPO structures the service agreement with the fleet operator. Under a charging-as-a-service (CaaS) model, the CPO typically charges the fleet operator a fixed monthly fee per vehicle or per port — covering hardware, software, maintenance, and often electricity — with readiness guarantees embedded in the service level agreement. This is fundamentally a B2B infrastructure contract, not a retail energy transaction.
How Depot Charging Differs from Public Charging
| Dimension | Fleet Depot Charging | Public Charging |
|---|---|---|
| Charging pattern | Scheduled, predictable, overnight | Random, on-demand |
| Load profile | High concurrency at shift-end, managed window | Stochastic, low average concurrency |
| Primary KPI | Vehicle readiness rate | Charger utilization rate |
| Commercial model | Fixed subscription / SLA | Per-kWh or per-session pricing |
| User | Known fleet vehicles (controlled access) | Anonymous public drivers |
| Demand charge risk | High — all vehicles return simultaneously | Moderate — organic traffic spread |
| Software need | Departure scheduling, fleet integration | Payment processing, roaming |
The 80/20 Rule for Fleet EV Charging
A well-established pattern in fleet electrification — confirmed by NREL’s medium- and heavy-duty vehicle charging analysis — is that approximately 80% of a commercial fleet’s total energy consumption can be satisfied at the depot during scheduled dwell periods. The remaining 20% comes from en-route opportunity charging at public or partner DC fast charging sites, used for range extension on longer routes or for vehicles that cannot fully recharge overnight due to operational exceptions.
This 80/20 split is the guiding principle for infrastructure investment. Over-investing in en-route charging while under-engineering the depot — or the reverse — misallocates capital. The depot is where the economics are won or lost. En-route charging is the safety net, not the primary strategy.
 and a public fast charger on the right (labeled 20%, en-route DCFC, opportunistic). Professional B2B infographic style, blue and gray palette, icons of delivery vans and charging symbols, no decorative elements")
Fleet Duty Cycle Patterns: Matching Infrastructure to Operations
There is no universal fleet depot charging design. The right solution for a last-mile delivery operation returning nightly is structurally different from the right solution for a transit agency running routes 18 hours a day. Before any hardware selection or electrical engineering begins, the operator must document the fleet’s duty cycle — the pattern of daily departure, operation, return, and dwell.
Pattern A: Overnight Return-to-Depot (Last-Mile Delivery)
Vehicles depart the depot between 6 and 8 AM, execute urban or suburban delivery routes, and return between 4 and 7 PM. The charging window is 10–12 hours — comfortably long for a full recharge from Level 2 AC equipment. This is the cleanest, most economical fleet charging scenario, and it describes the operations of most last-mile delivery fleets: Amazon DSP networks, FedEx Ground independent service providers, UPS private fleets, and regional courier operations.
NREL’s depot-based fleet charging analysis explicitly identifies this pattern as compatible with 6.6–11 kW AC Level 2 infrastructure: “AC Level 2 charging is sufficient for charging during longer (typically overnight) dwell periods at depots but is not suited for midday or en route charging.” For a van with a 100 kWh battery consuming 60–80 kWh on a typical urban delivery route, an 11 kW Level 2 charger restores full charge in approximately 6–8 hours — well inside the overnight window.
Primary charger: Level 2 AC (7.4–22 kW)
Charger-to-vehicle ratio: 1:1 (each vehicle needs its own charging position)
Demand window: 6 PM – 6 AM
Key risk: Simultaneous plug-in demand spike at return
Pattern B: Multi-Shift / Opportunity Charging
Vehicles operate in two or three shifts, with short windows (30–120 minutes) between route assignments. This pattern is common in municipal services, parcel delivery with tight urban density, and shared commercial vehicles. The brief dwell time means Level 2 AC cannot reliably restore sufficient charge — a 30-minute Level 2 session at 11 kW adds only 5.5 kWh, or roughly 20–25 miles of range for a delivery van. This pattern requires selective DC fast charging (50–150 kW) positioned at the depot to serve vehicles during the brief inter-shift window.
Primary charger: Level 2 AC overnight + DC fast charging (50–150 kW) for inter-shift top-up
Charger-to-vehicle ratio: DCFC serves 3–6 vehicles per port depending on dwell window and power level
Key challenge: Higher infrastructure cost; demand charge exposure during DCFC use
Pattern C: 24/7 Continuous Operations
Vehicles operate around the clock, with irregular return patterns and short minimum dwell times. This describes taxi and rideshare fleets, some logistics hubs, and airport ground support operations. These fleets have high daily energy demand (often 150–400 kWh per vehicle) and cannot rely on extended overnight dwell. DC fast charging dominates the depot configuration, and en-route public charging at third-party networks plays a larger role in the overall energy supply chain.
Primary charger: DC fast charging (100–350 kW) at depot; public DCFC for en-route
Demand management: Critical — DC charging creates sharp demand spikes with high concurrency risk
Key challenge: Highest infrastructure and operating cost per vehicle; most sensitive to demand charge exposure
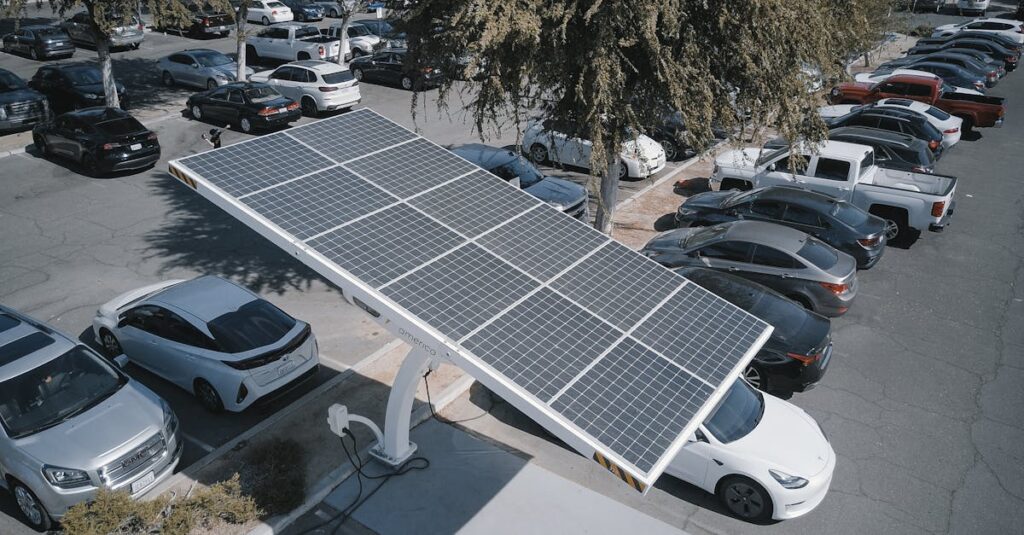
Pattern D: Daytime Dwell (Corporate and Government Fleets)
Vehicles are driven by employees between home and office or on field assignments, and charged at the depot (workplace) during business hours while parked. This pattern naturally aligns with solar PV production windows — daytime charging at a depot with rooftop solar can maximize self-consumption and minimize grid draw. Level 2 AC (7.4–22 kW) is typically sufficient given 6–9 hour dwell times, and the load is more predictable than return-to-depot delivery patterns.
Primary charger: Level 2 AC (7.4–22 kW)
Solar synergy: High — charging window coincides with PV production peak
Key advantage: Lowest demand charge risk of the four patterns
Charger Selection for Fleet Depots: The AC vs. DC Decision Framework
The most common — and most expensive — misapplication of depot charging capital is defaulting to DC fast chargers across the board because they are associated with “fast” and “professional.” For most fleet duty cycles, the opposite approach is correct: Level 2 AC as the primary workhorse, with DC added surgically where the duty cycle genuinely requires it.
Level 2 AC Charging: The Depot Workhorse
Level 2 AC chargers are the right primary solution for any fleet duty cycle with a dwell window longer than approximately four hours. They are dramatically less expensive than DC fast chargers in both hardware and electrical infrastructure cost, they impose a fraction of the grid demand, and they are fully compatible with the overnight charging pattern that describes most commercial fleets.
| Specification | Level 2 AC (Commercial) |
|---|---|
| Power output | 7.4 kW – 22 kW |
| Hardware cost per port | $400 – $6,500 |
| Installation cost per port | $1,500 – $6,000 (varies by trench distance) |
| Charge time (100 kWh battery, 11 kW) | ~9–10 hours (full depletion to full) |
| Charge time (60 kWh used, 11 kW) | ~5.5 hours |
| Grid impact per port | Low — 11–22 kW continuous |
| OCPP compatibility | OCPP 1.6 / OCPP 2.0.1 (smart charging required) |
| Best for duty cycle | Pattern A, D; Pattern B overnight portion |
AC EV chargers for North America designed for fleet environments should be specified with OCPP 2.0.1 compatibility from the outset — this is the prerequisite for departure-based scheduling, dynamic load management, and eventual V2G readiness. Specifying OCPP 1.6-only hardware to save cost today creates a mandatory hardware replacement cycle within 3–5 years as smart charging requirements mature.
DC Fast Charging for Fleets: When to Add It
DC fast charging is the right answer for specific, documented operational constraints — not as a default. The capital cost differential is substantial: a commercial-grade DC fast charger runs $18,000–$150,000 per port (30–150 kW range) before installation and electrical infrastructure costs, versus $400–$6,500 for Level 2 AC. Add the higher ongoing demand charge exposure, and DC becomes a premium solution that must be justified by a premium operational requirement.
| Specification | DC Fast Charging (Fleet Depot) |
|---|---|
| Power output | 50 kW – 350 kW per port |
| Hardware cost per port | $18,000 – $150,000+ (30–150 kW range) |
| Charge time (100 kWh battery, 100 kW DC) | ~60–70 minutes (10% to 80%) |
| Grid impact per port | High — 50–350 kW peak draw |
| Vehicles served per port | 3–8 vehicles/day (depending on dwell time) |
| Best for duty cycle | Pattern B inter-shift; Pattern C; heavy-duty vehicles |
Browse CCS1/NACS DC fast chargers for USA and Canada — including ETL-certified models in the 30–150 kW range suited for fleet depot applications where targeted fast charging supplements an overnight AC backbone.
The AC vs. DC Decision Matrix
- Dwell time > 8 hours: Level 2 AC only — no DC required for primary charging
- Dwell time 4–8 hours: Level 2 AC primary; add DC for vehicles that return with unusually low SoC
- Dwell time 2–4 hours: Level 2 AC for vehicles with modest daily range; selective DC for high-mileage vehicles
- Dwell time < 2 hours: DC dominant; Level 2 AC is not viable as a primary solution
- Vehicle daily range > 150 miles: Evaluate DC for partial recharge during mid-shift breaks
- Heavy-duty vehicles (Class 6–8): DC fast charging (150–350 kW) required; see Heavy-Duty section

The Demand Charge Problem: Why Unmanaged Charging Destroys Fleet Economics
Demand charges are the hidden variable that turns a financially viable fleet electrification plan into a budget crisis. Most fleet managers understand that they will pay for the electricity their vehicles consume. Far fewer understand that they will also pay — potentially for far more money — for the single 15-minute window of peak simultaneous draw that occurs when a fleet returns from the road and everyone plugs in at the same time.
Understanding How Demand Charges Work at Fleet Depots
Utilities bill commercial customers on two components: energy charges (kWh consumed, the number everyone knows) and demand charges (peak kW draw within any 15-minute billing interval, the number that catches fleet operators by surprise). The demand charge rate varies by utility and rate class — typical commercial rates in the US range from $8/kW to $22/kW per month, with many high-cost markets exceeding $15/kW. The key point: one 15-minute peak sets the demand charge for the entire month, regardless of how efficiently the fleet charges the other 99.9% of the time.
According to industry analysis, peak demand charges can represent 68–81% of total DCFC operating costs at sites with high-power DC charging and low average utilization. For Level 2-dominant depot configurations, the proportion is lower — but the spike risk is just as real when vehicles return simultaneously.
The Unmanaged Charging Scenario: A Worked Example
Consider a depot with 30 delivery vans returning between 4:30 and 5:00 PM. All plug in immediately upon return. Each charger draws 7 kW.
- Peak simultaneous draw: 30 × 7 kW = 210 kW
- Monthly demand charge at $14/kW: $2,940
- Monthly demand charge at $20/kW: $4,200
- Annual demand charge cost: $35,280 – $50,400
This is recurring, every month, regardless of season or route — because the demand charge is triggered by the pattern of simultaneous plug-in, not by the total energy consumed. Industry analysis documents the managed charging solution for this exact scenario: smart software spreading that same 30-vehicle charge event across an 8-hour window peaks at 80–100 kW instead of 210 kW. At $14/kW, that is $1,120–$1,400/month versus $2,940 — a saving of $1,540–$1,820 per month, or $18,480–$21,840 per year, from software configuration alone.
Scale this to 150 vans and the numbers are transformative. Fleet-scale research shows that unmanaged charging at 150-van depots can generate peak demand events of 2,800 kW or more — producing demand charges exceeding $42,000 per month. Smart charging management brings that peak down to a fraction of its unmanaged level.
How Smart Charging Management Addresses Demand Charges
The US Department of Energy’s managed EV charging guidance for federal fleets identifies four specific mechanisms that smart charging software deploys to control demand:
- Staggered start times: Rather than all vehicles beginning to charge the moment they plug in, software queues charging starts across a 2–4 hour window, dramatically flattening the load profile.
- Variable power delivery: Chargers are commanded to deliver less than their rated power when grid conditions or demand ceilings require, extending charge duration without reducing vehicle readiness.
- Departure-based prioritization: Vehicles with the earliest next departure are charged first at priority power levels; vehicles with later departures fill in around them at lower power.
- Demand ceiling enforcement: The software enforces a hard maximum site load — the system will never allow total simultaneous draw to exceed the programmed ceiling, regardless of how many vehicles are plugged in simultaneously.
Fleets using smart charging management consistently report up to 40% reduction in total electricity costs compared to unmanaged charging. Shifting 80% of charging load into off-peak rate windows (typically 9 PM – 6 AM) — enabled by departure scheduling — reduces energy cost per mile by 35–55% compared to unmanaged daytime charging.
Power Management Strategies: From Basic to Advanced
Smart charging is not a single feature — it is a capability stack. The layers build on each other, and each layer unlocks additional cost savings and operational intelligence.
Level 1: Load Balancing
The foundation of any depot charging management system. Load balancing distributes available site power across all connected chargers in real time, preventing any individual charger from drawing at full power in a way that trips the site’s electrical limits. This is non-negotiable for any depot with more than 10 chargers. Without load balancing, a site must provision its full electrical service for the theoretical maximum simultaneous load — which dramatically overstates the required grid connection and inflates demand charges.
Level 2: Departure-Based Scheduling
The single highest-value software feature for fleet operations. The system ingests each vehicle’s planned departure time — from the fleet management system or driver input — and calculates the minimum charging rate required to reach the target SoC by that time. Vehicles with 5 AM departures are prioritized and charged at higher power; vehicles not needed until noon are held at low power or paused entirely during the demand-sensitive early-evening window. This eliminates the fundamental tension between vehicle readiness and demand charge management: you get both, correctly engineered.
Level 3: Time-of-Use Optimization
Most commercial utility tariffs include time-of-use (TOU) pricing with significantly lower energy rates during off-peak hours — typically 9 PM to 6 AM in most US markets. Over 180 US utilities now offer commercial EV fleet programs that include TOU rate structures and managed charging incentives. TOU optimization software automatically shifts maximum charging load into the cheapest rate window, reducing per-kWh costs dramatically without any reduction in vehicle readiness. Annual savings of $18,000–$64,000 per depot are achievable at full off-peak optimization for mid-size fleets.
Level 4: V1G (Managed Smart Charging)
V1G — sometimes called “smart charging” or “managed charging” — adds two-way communication between the charger and a backend energy management system, allowing charging power to be modulated dynamically in response to grid conditions, price signals, or operator commands. Under OCPP 2.0.1, charging profiles can be pushed to individual chargers with sub-minute granularity. This enables demand response participation: the fleet’s charging load can be reduced during grid stress events, potentially generating revenue through utility demand response programs.
V1G requires OCPP 2.0.1-compatible hardware. This is the minimum hardware specification CPOs should require for new fleet depot deployments in 2026 — not OCPP 1.6, which lacks the smart charging profile granularity required for departure-based scheduling at scale.
Level 5: V2G (Vehicle-to-Grid)
V2G allows EVs to export power back to the grid or to the building during peak demand periods, turning the fleet’s battery capacity into a distributed energy asset. Fleet vehicles are better candidates for V2G than consumer EVs because their parking patterns are predictable, their SoC can be managed by the operator rather than the driver, and their battery sizing is typically larger.
The technical stack for V2G requires ISO 15118-20 communication between vehicle and charger (for bidirectional power flow negotiation), OCPP 2.0.1 between charger and backend, and an energy management system that can coordinate discharge schedules with grid or building demand signals. As Driivz and BloombergNEF note, V2G adoption is accelerating but not yet mainstream in the US market — the primary barriers are bidirectional charger hardware cost, limited vehicle-side ISO 15118-20 support across fleet vehicle models, and the need for utility programs that compensate discharge.
CPOs designing depot charging infrastructure for the 2026–2030 horizon should specify OCPP 2.0.1-compatible hardware today and plan V2G activation as a software upgrade path once the utility programs and vehicle compatibility mature in their market.
Industry Insight
Based on our fleet charging projects, electricity costs are often influenced more by charging strategy than charger power. In many commercial deployments, combining smart charging with energy management delivers greater long-term savings than simply installing additional DC fast chargers.
Site Electrical Assessment and Utility Coordination
Grid capacity is the constraint that turns a well-designed fleet electrification plan into a 12-month delay. The single most impactful action a fleet operator or CPO can take — before any vehicle purchase, before any charger specification — is engaging the local distribution utility to understand what the site’s existing electrical service can and cannot support.
Step 1: Assess Existing Electrical Capacity
Hire a licensed electrician to document the depot’s existing service entrance capacity, current loading, and available spare capacity. The numbers matter:
- A 200-amp panel at 208V three-phase provides approximately 72 kVA — enough for roughly 6–8 commercial Level 2 chargers at moderate concurrency with no other site loads
- A 400-amp, 480V three-phase service provides approximately 333 kVA — sufficient for 20–30 Level 2 chargers under managed charging
- A typical warehouse with significant HVAC, lighting, and dock equipment may already be using 60–80% of nameplate capacity, leaving far less headroom for EV charging than the service amperage suggests
Do not estimate this from a nameplate rating. Measure actual current loading at the busbar during operational hours.
Step 2: Calculate Required Fleet Charging Capacity
The required electrical service for a fleet depot is determined by two variables: the number of chargers and the managed concurrency factor.
Unmanaged concurrency: Total kW = (Number of chargers × Charger power kW) × 0.95–1.00
Managed concurrency: Total kW = (Number of chargers × Charger power kW) × 0.20–0.40
This is the most important calculation in fleet depot design. A 50-vehicle depot with 50 Level 2 chargers at 11 kW each:
- Unmanaged peak demand: 50 × 11 × 1.0 = 550 kW
- Managed peak demand: 50 × 11 × 0.30 = 165 kW
That 385 kW difference is the difference between a full utility service upgrade ($200,000–$500,000+, 12–18 month timeline) and working within an upgraded existing service (weeks to months). Smart charging management is not just an operating cost tool — it is an infrastructure sizing tool that directly determines capital expenditure.
Step 3: Engage the Utility 12–18 Months Before Your First Vehicle Arrives
Service upgrades require utility studies, engineering design, permitting, equipment procurement (transformers are on long lead times in 2026), and construction. Industry planning guidance consistently identifies 6–18 months as the expected timeline for utility service upgrades, and this timeline starts from the date of the interconnection application — not the date vehicles arrive.
Key questions for the initial utility meeting:
- What is the available capacity at our service entrance, and what upgrade would be required to serve our planned fleet load?
- Do you offer a commercial EV fleet rate or a managed charging incentive program?
- Is there a make-ready program (utility-funded service upgrade) for fleet electrification customers?
- What demand charge rate class would apply to our planned load?
- Are there TOU rates available that reward off-peak overnight charging?
Over 180 US utilities offer commercial EV fleet programs — including Pacific Gas and Electric, Southern California Edison, Xcel Energy, and Duke Energy — that can reduce net infrastructure cost by $5,000–$25,000 per charging port before federal and state incentives are applied. These programs require advance application and often have capacity caps; early engagement is essential.
For site selection and utility interconnection strategy in more depth, see our complete guide to EV charging site selection and permitting.
Step 4: Oversize Conduit and Infrastructure From Day One
Phase 1 of a fleet depot deployment typically covers 25–50% of the eventual fleet size. Phase 2, Phase 3, and beyond will require additional chargers. Installing the conduit, main feeder, and electrical panel for the full 5-year fleet target on the first construction mobilization costs a fraction of what it costs to excavate and re-trench later. Pulling additional wire through existing conduit is a day’s work. Re-excavating the yard is a project.
Standard practice: install conduit sized for the Phase 3 fleet target. Install panel and feeder capacity for the Phase 2 fleet target. Deploy chargers for Phase 1 only. This approach eliminates the most expensive retrofit scenario while keeping Day 1 capital expenditure proportional to Day 1 fleet size.
Last-Mile Delivery Fleets: The Largest and Fastest-Growing Segment
Last-mile delivery is the defining fleet electrification market of 2025–2030. Amazon’s deployment of Rivian EDVs provides the most visible and extensively documented real-world data on how depot charging works at scale.
Amazon and Rivian: A Real-World Benchmark
Amazon now operates more than 30,000 Rivian Electric Delivery Vans (EDVs) across its US delivery network as of early 2026, on a path to 100,000 units by 2030. Each EDV is equipped with a 100 kWh LFP battery supporting 11 kW AC charging and 100 kW DC fast charging. Amazon deliberately chose overnight AC Level 2 charging as the primary charging method — using AI-based route planning to ensure that no van would ever exhaust its charge before returning to the depot.
For a 100-van Amazon DSP depot, the nightly charging math is:
- Each van uses approximately 60–80 kWh per day (typical 80–100 mile urban delivery route)
- 100 vans × 70 kWh average = 7,000 kWh per night
- Equivalent to the daily electricity consumption of approximately 230 US homes
- Primary charger: 11 kW Level 2 AC with departure-based smart scheduling
- Managed peak demand: approximately 150–200 kW (versus 1,100 kW unmanaged)
Amazon’s decision to use AI-optimized route planning to constrain daily range — and therefore daily energy consumption — is the single most important demand management strategy in the program. By ensuring that no van needs more than 80–90% of its battery capacity on any route, the depot can reliably charge every vehicle in the overnight window without DCFC.
Depot Layout Considerations for Last-Mile
- Cable reach and parking alignment: Chargers should be positioned so that the cable reaches the vehicle charge port without spanning a traffic lane. Layout planning must account for van length, turning radius, and the charger’s cable length (typically 15–25 feet).
- Environmental durability: Depot environments are hard on hardware — dust, vehicle exhaust, physical impact from forklifts and loading equipment, temperature extremes. Specify NEMA 3R or NEMA 4 enclosure ratings for all outdoor and semi-outdoor installations.
- Traffic flow safety: Ensure that the charging layout does not create a pedestrian safety conflict with vehicle movement. Bollard protection for charger columns is standard practice in warehouse yard environments.
- Spare conduit capacity: Pull spare conduit to every planned charger location from day one. Growth happens faster than planned.
Heavy-Duty Fleet Depot Charging: Class 6–8 Trucks and Transit Buses
Heavy-duty vehicles are a fundamentally different engineering challenge. The battery sizes, power requirements, and grid impacts are not incrementally larger than light-duty — they are categorically different.
The Heavy-Duty Power Challenge
According to US DOT data, electric transit buses carry batteries in the 250–660 kWh range. Electric Class 8 long-haul trucks can reach 600–900 kWh. A single Class 8 truck charging at 350 kW draws more power than a 30-van last-mile delivery depot charging simultaneously under managed conditions. A 20-bus transit depot charging overnight at 150 kW per bus could draw 3 MW of peak demand — requiring a dedicated substation.
| Vehicle Class | Battery Size | Daily Energy Use | Min. Charger Power (8-hr window) | Preferred Charger |
|---|---|---|---|---|
| Class 2–3 (Delivery Van) | 60–135 kWh | 40–90 kWh | 7–11 kW (AC Level 2) | Level 2 AC 11–22 kW |
| Class 4–5 (Medium Truck) | 150–300 kWh | 100–200 kWh | 20–25 kW (AC); 80+ kW (DC) | High-power AC or DCFC 50–100 kW |
| Class 6–7 (Heavy Truck) | 200–400 kWh | 150–300 kWh | DCFC 100–200 kW | DCFC 150–250 kW |
| Class 8 (Semi Truck) | 400–900 kWh | 250–500 kWh | DCFC 350 kW or MCS | DCFC 350 kW / MCS 1+ MW |
| Transit Bus (40 ft) | 250–660 kWh | 150–350 kWh | 50–125 kW overnight | DCFC 150–350 kW; pantograph for opportunity |
Megawatt Charging System (MCS) for Class 8 Trucks
The Megawatt Charging System — standardized as SAE J3271 in June 2024 — supports up to 3.75 MW at 1,250 volts, enabling a 15-minute partial recharge for vehicles with 400–500 kWh batteries. MCS hardware entered commercial deployment in 2025–2026 and is the long-haul trucking industry’s answer to range anxiety at highway scale. For depot applications, MCS allows Class 8 trucks with predictable departure times to be brought from low to near-full SoC in under 30 minutes during a shift break, enabling multi-shift operations that overnight AC charging cannot support.
MCS installations require dedicated transformers and switchgear sized for megawatt-level loads — a project-level grid intervention, not a standard commercial service upgrade.
Transit Bus Depot Design
With approximately 90% of bus charging occurring at the depot, transit agencies are in many ways the highest-stakes fleet electrification customers. A 40-foot battery-electric bus consumes 150–350 kWh per operational day depending on route density, climate, and auxiliary loads (HVAC is the largest variable). For urban transit agencies operating continuous service, the combination of overnight depot charging and pantograph opportunity charging at terminal layovers is the standard architecture: depot charging handles the bulk energy, pantograph opportunity charging tops up batteries during the natural schedule gaps without removing the bus from service.
Transit depot electrical requirements are substantial. A 50-bus depot with overnight charging at 90 kW average power per bus requires a 4.5 MW peak electrical service — comparable to a small industrial facility. Early and sustained utility engagement is non-negotiable for transit electrification projects. The New York MTA, which is targeting a fully electric bus fleet of 5,800 buses by 2040, has documented the need for dedicated substation investment at each of its depots as a fundamental cost of the electrification program.
For depot-scale energy solutions including behind-the-meter storage integrated with DC charging, explore energy storage systems for EV charging designed for high-power fleet applications.
Solar + Storage Integration at Fleet Depots
Fleet depots present a specific solar integration challenge: the largest energy demand occurs overnight, when solar produces nothing. Solar PV production peaks between 10 AM and 3 PM — precisely when the fleet is on the road and the depot’s EV charging load is minimal. Without battery storage as the intermediary, solar contributes very little to a return-to-depot fleet’s energy budget.
How Solar + Storage Solves the Timing Mismatch
A behind-the-meter battery energy storage system (BESS) acts as the bridge between solar production and depot charging demand:
- Solar PV charges the battery during the day (10 AM – 3 PM) while the fleet is on route
- The battery stores that energy, offsetting the need for grid draw
- When the fleet returns (4 PM – 7 PM), the battery discharges to contribute to the initial charging load
- The battery continues discharging into the overnight window, reducing demand charges and grid draw
The economic case has two layers: demand charge reduction (the battery flattens the demand spike that would otherwise occur at vehicle return) and energy cost reduction (the solar energy stored during off-peak hours offsets on-peak or higher-rate grid electricity).
Battery Sizing Guidelines for Fleet Depot Solar + Storage
| Depot Scale | Vehicle Count | Estimated Nightly kWh | Recommended BESS Energy | Recommended Solar PV |
|---|---|---|---|---|
| Small depot | 10–20 vans | 700–1,400 kWh | 100–200 kWh | 50–100 kW |
| Medium depot | 20–50 vans | 1,400–3,500 kWh | 200–500 kWh | 100–250 kW |
| Large depot | 50–100 vans | 3,500–7,000 kWh | 500–1,000 kWh | 250–500 kW |
| Heavy-duty hub (buses/trucks) | 20–50 vehicles | 5,000–15,000 kWh | 1,000–3,000 kWh | 500 kW – 2 MW |
The federal incentive landscape for solar and storage shifted materially in 2025. The 30C Alternative Fuel Vehicle Refueling Property Tax Credit (up to 30% of EV charging equipment cost, capped at $100,000 per item of property in qualifying census tracts) and the Section 48 Investment Tax Credit (30% for qualifying solar and storage systems meeting prevailing wage and apprenticeship requirements) remain the primary federal financial tools as of 2026. However, CPOs and fleet operators should verify current credit availability with a qualified tax advisor — the legislative environment has been active, and several IRA provisions have been modified.
State and utility incentive programs represent a significant additional opportunity. California’s HVIP (Hybrid and Zero-Emission Truck and Bus Voucher Incentive Project) offers up to $60,000 per heavy-duty truck. New York, Colorado, Oregon, and Washington all have active fleet electrification programs. The DSIRE database (dsireusa.org) is the authoritative source for state-level incentives by technology and location.
Phased Deployment: Start Smart, Scale With Data
The worst fleet depot charging projects are the ones designed for the full 5-year fleet target and built all at once — before anyone knows what the actual demand patterns look like, which vehicles have charging exceptions, or how the utility rate interacts with operational schedules. The best projects are phased: build the electrical infrastructure for scale, deploy the charging hardware incrementally, and let operational data drive each subsequent phase.
Phase 1: AC Baseline and Monitoring (Months 0–6)
Deploy Level 2 AC chargers for 25–50% of the fleet. Install basic load management software with OCPP 2.0.1 connectivity. Integrate telematics or fleet management system data for departure time inputs. During this phase, collect the data that will define Phase 2:
- Vehicle-ready-on-time percentage (target: >95%)
- Average kWh consumed per vehicle per day
- Actual peak demand events and timing
- Vehicles that regularly return below 20% SoC (candidates for DCFC priority)
Phase 2: Expansion and Demand Optimization (Months 6–18)
Add charging ports based on Phase 1 utilization data. Implement departure-based scheduling and TOU optimization. Apply for utility managed charging incentive programs using Phase 1 operational data as the enrollment basis. Trigger for Phase 2 expansion: recurring queuing events where vehicles cannot access a charger within 30 minutes of return, or readiness failures affecting more than 5% of the fleet.
Phase 3: Selective DC and Renewable Integration (Months 12–24)
Deploy DC fast chargers at positions identified by Phase 1–2 data as bottlenecks — typically vehicles on longer routes that return with insufficient SoC for overnight Level 2 recharge. Evaluate solar + storage based on the site’s measured demand charge exposure and rooftop/canopy availability. At this phase, the investment case for storage is documentable from real utility bills rather than projections.
Phase 4: V2G Readiness and Grid Integration (24+ Months)
Hardware specified as OCPP 2.0.1-compatible from Phase 1 is already V2G-ready at the protocol level. This phase activates demand response programs, evaluates ISO 15118-20 vehicle compatibility across the fleet, and integrates with utility flexibility markets where available. The revenue potential from V2G and demand response programs is real but depends heavily on the local utility’s program structure — which is why V2G should be planned as a pathway, not a Day 1 commitment.
Integrating Charging Data with Fleet Management Systems
Charging data is not a separate operational data stream — it is fleet maintenance data, dispatch intelligence, and cost accounting rolled into one. CPOs designing depot charging solutions should build the data integration architecture as carefully as the electrical architecture.
Charge-Aware Vehicle Dispatch
The most operationally valuable integration is a real-time connection between the charging management system’s SoC data and the fleet management system’s dispatch logic. Before any vehicle is assigned to a route, the system checks: what is this vehicle’s current SoC, and will it reach minimum required charge by departure time given its position in the charging queue? This eliminates the “battery at 12% at 5:45 AM” scenario — the single most common cause of fleet EV dispatch failure in early-stage electrification programs.
Energy Cost Tracking Per Vehicle
Networked chargers with OCPP 2.0.1 transaction records can track kWh delivered per vehicle ID per session. This enables true cost-per-mile analysis at the vehicle level — not just fleet-average estimates. Vehicles consuming more energy than peers on similar routes are flagged for maintenance review; battery degradation, tire condition, and driver behavior all show up in energy efficiency data before they appear in mechanical failure.
Federal Fleet Reporting Requirements
Federal agencies operating EVs are required to track and report specific data elements for each charging event: vehicle ID, date, charging location, kWh consumed, and energy cost. Networked EVSE with OCPP transaction logging satisfies these requirements automatically. Fleet operators pursuing state or federal incentive programs should verify that their charging management system can export data in the required format before deployment — retrofitting reporting capability after the fact is a common and avoidable headache.
Fleet Depot Charging Design Checklist
Phase 1: Fleet Operations Assessment
- ☐ Document duty cycle for each vehicle class: departure time, return time, daily miles, route type
- ☐ Calculate daily kWh per vehicle (route miles × vehicle energy consumption rate)
- ☐ Identify vehicles with short inter-shift dwell windows requiring DC fast charging
- ☐ Confirm fleet growth forecast for years 1, 3, and 5
- ☐ Determine vehicle readiness requirement (target SoC and departure time for each vehicle class)
Phase 2: Site Electrical Assessment
- ☐ Document existing service entrance: voltage, amperage, phase configuration, current load
- ☐ Calculate managed peak demand for full fleet (vehicles × charger kW × managed concurrency factor)
- ☐ Identify gap between available spare capacity and fleet charging requirement
- ☐ Engage utility: schedule pre-application meeting, request capacity study
- ☐ Apply for utility make-ready or fleet electrification program
- ☐ Identify TOU rate schedule and model off-peak cost savings
Phase 3: Charger Selection and Power Management Design
- ☐ Select primary charger type (Level 2 AC vs. DC) based on duty cycle matrix
- ☐ Specify OCPP 2.0.1 compatibility on all hardware
- ☐ Size conduit and feeder for 5-year fleet target
- ☐ Design departure-based scheduling system and demand ceiling
- ☐ Evaluate solar + storage based on demand charge exposure and roof/canopy availability
Phase 4: Installation and Commissioning
- ☐ Install oversized conduit infrastructure first (pull-through wire later)
- ☐ Commission OCPP backend connectivity and test with all deployed chargers
- ☐ Integrate fleet management system / telematics for departure scheduling
- ☐ Set and test demand ceiling in charging management software
- ☐ Document baseline utility bill before fleet charging begins (for savings verification)
Phase 5: Operations and Continuous Optimization
- ☐ Monitor vehicle-ready-on-time rate weekly (flag if below 95%)
- ☐ Review demand charge events monthly — identify and address any ceiling breaches
- ☐ Track kWh per vehicle per day — flag outliers for maintenance review
- ☐ Enroll in utility demand response program when Phase 1 operational data is available
- ☐ Evaluate Phase 2 expansion triggers quarterly
Frequently Asked Questions About Fleet Depot Charging
What is depot charging and why is it different from public charging?
Depot charging is a private, controlled model where a fleet’s vehicles charge at a central facility during scheduled off-duty periods. Unlike public charging — which serves anonymous drivers on demand and is optimized for charger utilization — depot charging is optimized for vehicle readiness. The commercial model is typically a fixed subscription fee rather than per-kWh retail pricing, and the charging schedule is managed by software rather than driver preference.
How many Level 2 chargers do I need for my fleet?
For a return-to-depot fleet with overnight dwell times, the standard ratio is 1:1 — one charging position per vehicle. This does not mean one active charger per vehicle simultaneously; it means each vehicle needs a dedicated parking and charging position available when it returns. Smart charging software manages which vehicles are actively drawing power at any moment, but each vehicle must have a place to plug in.
When does a fleet depot need DC fast charging?
DC fast charging is necessary when a vehicle’s dwell time at the depot is shorter than what Level 2 AC can use to restore sufficient range — typically less than 3–4 hours for a vehicle that uses 60–80 kWh per day. Multi-shift operations, vehicles on exceptionally long routes that return with very low SoC, and heavy-duty vehicles with large batteries and short overnight windows are the primary candidates. For most return-to-depot last-mile delivery fleets, Level 2 AC with smart scheduling is sufficient.
How much can managed charging save on a depot electricity bill?
Fleets using smart charging management consistently report up to 40% total electricity cost reduction compared to unmanaged charging. The mechanism is two-fold: demand charge reduction (managed concurrency prevents the peak that sets the monthly demand charge) and TOU optimization (charging shifted to off-peak windows at lower kWh rates). A 30-vehicle depot with $14/kW demand charges can save $1,500–$2,000 per month from smart charging software alone — $18,000–$24,000 annually.
Do I need to upgrade my electrical service for fleet charging?
Almost certainly, yes — unless the depot is a new facility built with EV charging in mind, or the fleet is very small (<10 vehicles). The degree of upgrade depends on existing capacity and the fleet size. With managed charging software, the required service upgrade is significantly smaller than unmanaged calculations suggest. Engage your utility early — service upgrades take 6–18 months and should be initiated at least 12 months before your first vehicle arrives.
What is the 80/20 rule for fleet EV charging?
As documented by NREL’s fleet charging research, approximately 80% of a commercial fleet’s total energy demand can be satisfied by depot charging during scheduled overnight or dwell periods. The remaining 20% comes from en-route or destination charging at public or partner facilities. This split is the foundation of fleet electrification capital planning: the depot infrastructure is the primary investment; en-route public charging is the backup, not the primary solution.
What incentives are available for fleet depot charging infrastructure in 2026?
The incentive landscape has shifted since mid-2025. The 30C EV infrastructure tax credit (up to 30% of cost, capped at $100,000 per item of property in qualifying census tracts) remains available under current law — verify current status with a tax advisor. Utility make-ready programs (often $5,000–$25,000 per port) are active at over 180 US utilities and represent the largest available incentive for most fleet operators. State programs including California HVIP, NYSERDA fleet programs, Colorado RAQC, and others provide additional support. Check current federal program status at the DOE Alternative Fuels Station Locator and state programs at dsireusa.org.
Key Takeaways
- Fleet depot charging is built around one KPI: vehicle readiness rate, not charger utilization. Every design decision flows from that metric.
- Most return-to-depot fleets — including last-mile delivery with 8–12 hour overnight dwell — are best served by Level 2 AC as the primary charger. DC fast charging is a targeted solution for specific duty cycle constraints, not a default.
- Demand charges from unmanaged simultaneous plug-in are the #1 hidden cost driver. Smart charging management with departure-based scheduling is the solution — not overbuilding electrical service. Managed concurrency factors of 0.20–0.40 versus unmanaged 0.95–1.0 determine the difference between a practical service upgrade and a prohibitive one.
- Engage the utility 12–18 months before vehicles arrive. Service upgrades take time. Over 180 US utilities offer EV fleet programs that can significantly reduce net infrastructure cost.
- Install conduit and feeders for the 5-year fleet target on the first construction mobilization. Deploy chargers only for Phase 1. Retrofitting conduit later costs far more than oversizing from day one.
- Solar + storage at fleet depots requires battery storage as the intermediary — solar alone doesn’t help overnight-charging fleets without a BESS to shift daytime production into the charging window.
- Specify OCPP 2.0.1-compatible hardware for every new depot deployment. This is the prerequisite for departure scheduling, demand response, and V2G readiness as those capabilities mature.
Looking for the right hardware foundation for your fleet depot project? Explore AC EV chargers for North America — including commercial-grade Level 2 units designed for managed fleet environments — and energy storage systems for EV charging optimized for behind-the-meter demand charge management at depot scale.
Utility rates, federal incentive programs, and regulatory requirements referenced in this article are subject to change. Verify current requirements with your utility, local authority having jurisdiction, and qualified tax advisor. Last reviewed: May 2026.
Related Posts
MyFirstEV Is Coming: Which EV Chargers Will the Market Need?
Last updated: July 15, 2026 California’s MyFirstEV programme is expected to lower the upfront cost…

What Is MyFirstEV? California’s New EV Rebate Explained
Last updated: 15 July 2026 MyFirstEV is California’s new point-of-sale rebate programme for residents buying…
What Is CALeVIP? California’s 2026–2027 DC Fast Charging Incentives Explained
Last updated: July 15, 2026 California is providing $55.2 million in new funding for publicly…
Is There Still Room for a New Private Label EV Charger Brand?
The honest version of that question sounds like this: the EV charger market is obviously growing…

Private Label EV Charger Launch: Complete Checklist
Most private label EV charger brands spend months getting the product right — and maybe…
EV Charger ODM Checklist: 20 Things Before Signing
The manufacturer’s contract is written to protect the manufacturer. That’s not cynicism — it’s just…
